 EMAAR Energy
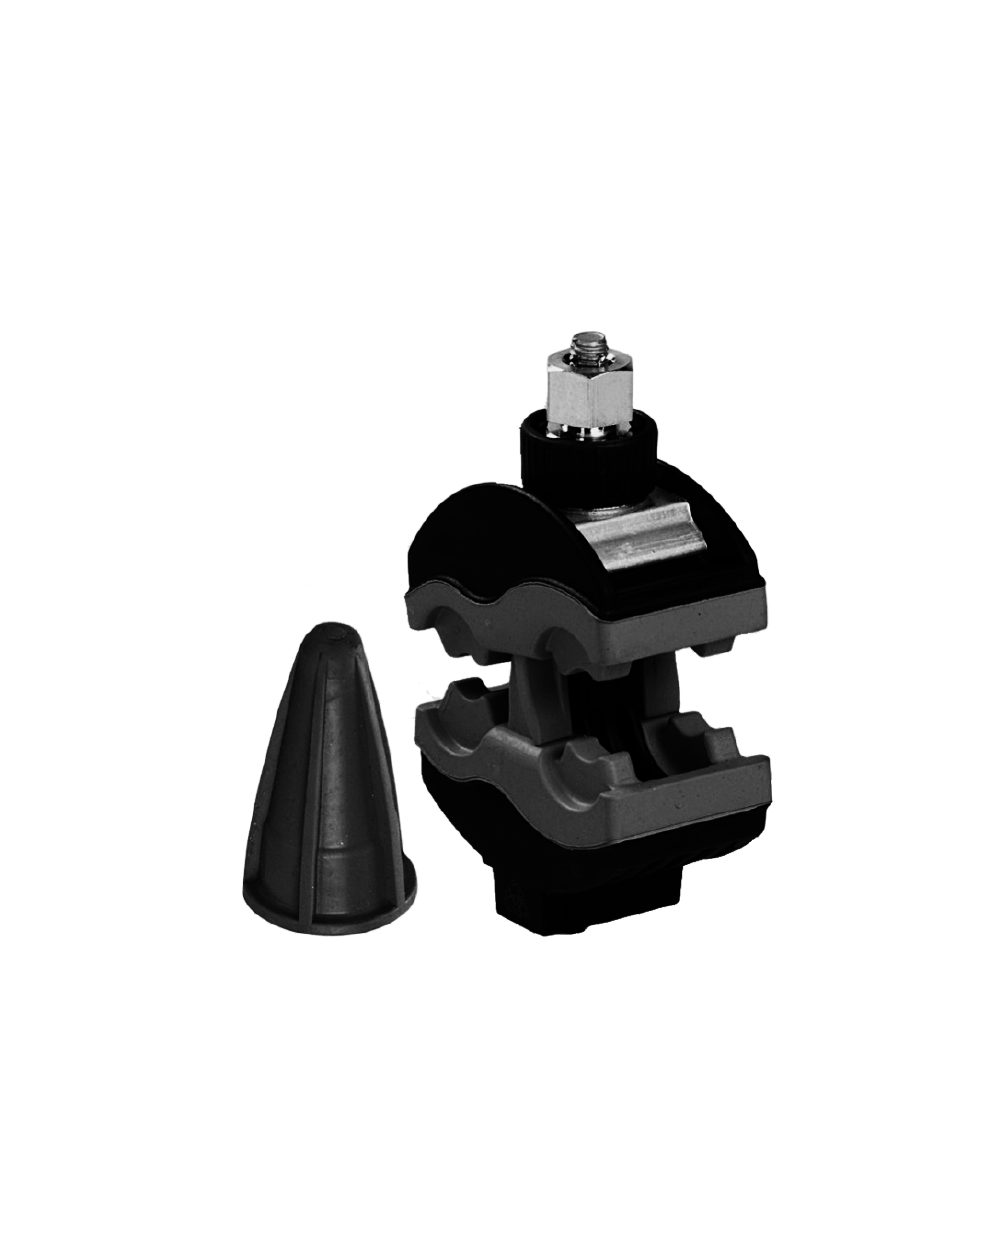
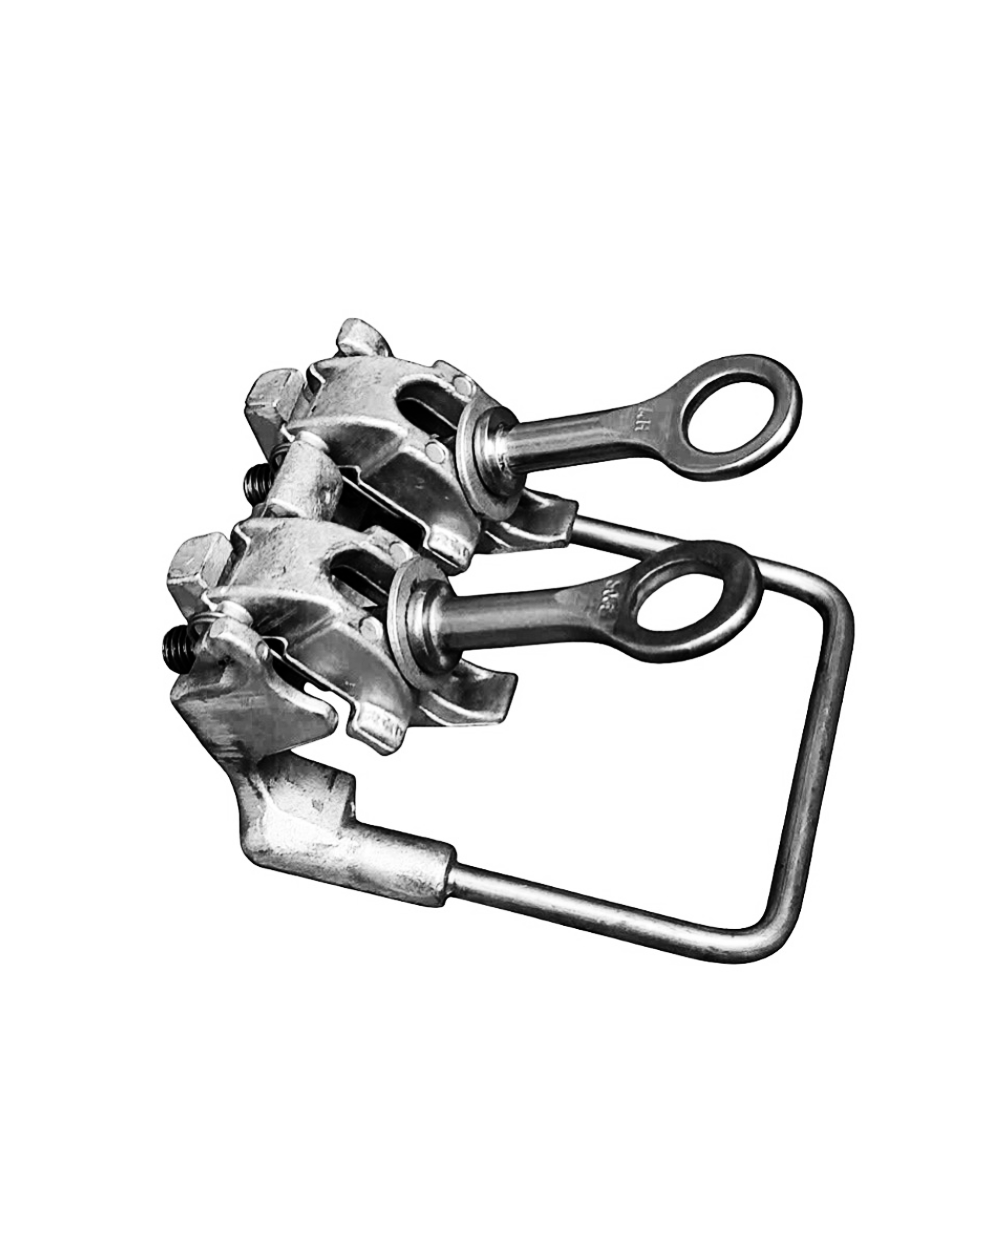
OH - ABC - Clamp - PINCE-VAMP
Insulation Piercing Connectors (IPC) PINCE-VAMPx have been used in most North American countries along with Aerial Bundled Conductor LV systems for 20+ years and in other areas of the world for 40+ years. Over this time utilities and accessory manufacturers have been able to gather and share important return on experience strengthening the reliability of this type of networks. This has led to define and refine standards and requirements. International and national standards for IPC are a strong basis to secure safety and reliability over time. However, no current standard is seriously considering how efficient LV connectors are or could be. Less obvious than transformer efficiency, LV IPC connectors have their own resistance and do contribute to the overall LV network efficiency. While the actual resistance of an LV connector may seem insignificant, it turns out that there can be very wide discrepancy in the overall resistance of LV connectors. Considering that for most Asian utilities multiple hundreds of thousands of connectors are installed every year – for an expected lifespan of 20-40 years, the consolidated impact of LV IPC’s resistance resulting in technical losses can be very significant on the network. This paper will present at first a quick overview of reference standards and specifications on IPCs available to set a reference framework. This shall be followed by a short warning on the dreadful impact that can have sub-standard IPCs. We will then define ‘efficiency’ of LV ABC connectors and how the resistance of these connectors can be assessed. This shall be an opportunity to understand why electrical ageing sanctions proposed by most international or national standard do not provide appropriate information to utilities on connector’s efficiency and to highlight how data derived from these tests can be better used. In a later paragraph will be illustrated the main drivers leading to more efficient IPC connectors. We’ll highlight critical criteria over the whole product cycle such as design, material used, quality control, product installation and usage. Beyond actual design of the product, the easiness of installation for linemen is essential to obtain sustainable and consistent performance over a constellation of connectors. These drivers will then be presented in practical points that could be assessed in tendering processes. At the end of the paper we shall summarize the opportunity offered to utilities to reduce losses in LV networks if addressing connector resistance. We shall give highlights on the impact that utilities can expect if tackling this issue and also provide general guidelines on how to adjust sourcing practices to take into account efficiency in the overall cost for the utilities.

Specifications
INTERNATIONAL STANDARDS
For most utilities, referring to an international standard when tendering is a useful and convenient way to segregate products and tenderers. Compliance to a broadly used international standard offers the utility both insurance that a basic set of quality criteria are met as well as a grid for a fair technical appreciation of products offered – while rules and regulations require more and more transparency in the tendering processes. After a first set of exploratory national specifications earlier, 2 reference standards have emerged: VDE 0220-3 and NF C33-020 (06/1998). The NF C33-020(98), though, has provided a safety and reliability breakthrough introducing 6kV underwater voltage test as well as reliable environmental test simulating genuinely 30-40 years of service in demanding UV or humidity environments. Thanks to these additional technical criteria, NF C33-020(98) became, and remains to a large extent, an inspiring reference to most national and utility standards and specifications in Asia and around the world. While an international standard has yet to emerge, there has been an attempt in the 2000’s to consolidate the European national standards into a common standard: EN 50483. This has been an interesting step toward defining a multi-national standard. However, this document has essentially enacted in writing very different practices and converted them into various ‘options’ within the standard. As a consequence, depending on the ‘options’ selected by the customer, compliance to EN 50483 standard may result in products presenting drastically different level of performance (insulation, protection, waterproofness, electrical). As an example, the climatic ageing test may, in this standard, be performed under various methods from the most exigent for class 1 method 1 (equivalent to NF C33-020) to much less complete assessment for class 2. Also, the 6kV under water dielectric test, synonym of safety for IPCs for the last 20 years is only presented as an ‘option’ in this EN 50483 standard. While initially an opportunity to improve quality (introduction of 1000 cycles in the electrical ageing test), EN 50483 presents in fact an opportunity for confusion. One must call utilities to caution when transposing this EN 50483 standard in to their specifications. Assessing in detail the actual performance of products claiming compliance to that standard is a must to avoid quality downgrade. Nevertheless, NF C33-020 standard has evolved into a 2013 revision. That new version of NF C33-020(2013) is actually based on the EN 50483 (incl. 1000 cycle electrical ageing test). NF C33-020(2013) is an interesting reference document as its pre-selects ‘options’ of the EN 50483 ensuring at least the NF C33-020(1998) level of quality. This simplifies evolution to this new generation of standards.
This new evolution of NF C33-020 allows securing without confusion at least the corpus of performance that has been now proven over 20 years, including:
- Class 1 - Voltage dielectric test 6kV under water.
- Class A - electrical ageing with short circuits for network connectors above #2 AWG cross section.
- Method 1 climatic ageing test
It is to be noted than ANSI C119 committee has issued in 2009 a new American standard on Insulation Piercing Connection (C119.5). That standard has yet to be truly embraced. While no International standard actually exists, the NF C33-020 from 1998 has become a de-facto reference in many Asian and International countries. The 2013 release of that NF C33-020 now provides to standard committees and specification engineers a clear path to project IPC standards into the latest framework of performance requirement.
IMPACT OF IPC ON NETWORKS AND QUALITY SYSTEM
Before to expose how IPCs can contribute to the overall network efficiency, it is crucial to remind that sub-standard IPCs will significantly downgrade both efficiency and reliability of LV ABC networks. IPCs have become a commodity for most utilities and numerous more or less scrupulous suppliers claiming compliance to standards have emerged. Substandard IPCs have essentially 3 sorts of impact on the network: 1/ connection failure, 2/ losses increase due to hot connection, 3/ breach the overall network reliability.
1/ The most obvious issue related to installation of substandard IPCs is actual connector’s failure: Any connector failure will A/ create an outage to one or multiple customers, B/ require crew to be dispatched, C/ make some damages to customer appliances if neutral is breached, D/ will require additional material and conductor to repair and E/ create a safety hazard (fire, insulation breach…). Each utility shall be in a position to assess induced cost compared to short term purchasing savings. Taking into account points A through D of the previous paragraph (few hours of a trained crew time, truck fuel, time and maintenance, replacing components, replacing appliances when neutral is breached, consumer relationship, quality and overhead involved in solving the case…) we can estimate an average cost to the utility for an IPC failure of ~400$ – putting aside the yet very important safety hazard (point E/, difficult to quantify). Considering such ~400$ toll for each failed connector, a failure rate as low as 1 out of 120 000 IPC per year of service will impact over the lifespan the initial cost of the IPC by about 10 cents. While each utility may adjust this calculation to their own situation, the provided order of magnitude is clear that IPC reliability is a key criterion when assessing technical offer. It is worth mentioning – as an illustration - the case of a significant utility sourcing roughly 1 million IPCs per year. In a legitimate attempt to optimize sourcing cost, this utility has sacrificed on IPC quality. Facing such failure ratio, this utility changed standard to use 2 IPCs on Neutral cable, and that for the entire network. As a result, to save a few cents on unit price, there is an additional permanent cost of 25% due to required additional volume (excluding installation), whichever the quality of products.
2/ Second impact of sub-standard connector is tied to losses due to high resistance: We’ll deep dive this subject in the next paragraphs. It is however worth mentioning that the cost of sub-standard connectors is much higher when they don’t fail rather than when they fail. Indeed, based on the calculations presented further in this paper, each substandard connector installed running ‘hot’ may cost in losses 1-2 USD per year in operation.
3/ Last impact of substandard connectors, while not easy to evaluate, is actually more devastating: The LV ABC network concept is based on the principle of complete insulation from end to end. There are many benefits to that amongst which safety and protection against water (and therefore galvanic corrosion). One of the most common flaws of substandard connectors is the poor quality of the thermoplastic raw materials. This leads to excessive relaxing, cracking and lack of resilience. The problem here is that water can penetrate from the connection area and then infiltrate into the ABC network. Then, with water inside, both safety and reliability of the network get corrupted: insulation, corrosion. While only few percent of the cost of an LV ABC network, substandard IPCs will in this condition jeopardize the overall asset. This has unfortunately leaded several major Asian countries to reconsider the IPC technology altogether after sub-standard IPC experience.
At the end of the article we shall summarize good practices as per connector and supplier selection not only to avoid these substandard connectors, but also to improve overall network efficiency thanks to the upcoming considerations.
CONNECTOR ELECTRICAL EFFICIENCY DEFINITION
As any ‘passive’ component of the network, low voltage connectors could be compared to a very small resistance that would be in series of a derivation as illustrated below. This resistance will result in heat losses following one of the most trivial electrical formulas: P=RxI2. At this stage, it is crucial to highlight another cliché of electricity to further understand why this question of losses is crucial for LV IPCs: P = U x I. Indeed, IPCs are used in low voltage network. The lower the voltage, the higher is amperage, which is why 2/3 of technical losses in network happen in the MV and LV network 1. The fact is, in most countries, the whole electrical energy distributed flows through 4 or more IPCs before to reach any meter. Considering that losses are proportional to the square of amperage, even if connector resistance may appear typically fairly low (between a few dozen and a few hundred micro-ohms) these millions of connectors will act as very small ever turned on heater which, we’ll see, add up to significant figures. We will call efficiency of a connector its capacity to keep losses – and therefore overall resistance – low throughout its lifespan (and not only at installation).
WHY STANDARDS DO NOT SECURE EFFICIENCY?
All the reference standard mentioned above have been set up by the industry in order to ascertain that products will be reliable over time. The main test in order to assess electrical performance of a connector is the heat cycling (also known as electrical ageing) test. As a reminder, the principle of the test is to create a loop. Temperature rise cycles are applied to the loop with high currents flowing through the conductors and connectors. These cycles allow simulating the behavior of the connector which will be submitted to current variations over time. Besides consistency of performance, heat cycling test only assesses evolution of resistance and not the value of resistance itself. As an example, for EN 50483-5 standard, installing 1000 cycles test, the actual sanctions as per resistance will be that 1/ the end resistance is less than 2 times initial resistance and 2/ that end resistance is less than 15% more than intermediate resistance at 250 cycles.
This sanction is really focusing only on stability of the connector. In other words, it makes sure the connector will work over time. However, it doesn’t give any real sanction on the efficiency of the connector. Worse actually, such sanction will favor, within limits connectors presenting higher resistance. Indeed, as the sanction is only based on percentages, the highest is the initial value, the more ‘room’ the manufacturer will have for resistance increase over time. As an example, a connector presenting a very low resistance of 10 µΩ at cycle 250 will fail heat cycling test if resistance reaches the still very low value of 12 µΩ at the end. With only 2 µΩ increase, such truly efficient connector will not pass the test. In the contrary, a connector presenting a resistance value of 100 µΩ at 250 cycles can increase up to 115 µΩ which represent. This second connector is a less efficient connector presenting with more unfavorable evolution in resistance but still complies with standard. While it is advisable to enforce the typical heat cycling test sanctions on resistance evolution to ascertain stability over time, this example clearly shows that passing test result to electrical ageing test is not an indication on the connector’s efficiency. In order to propose a measurable, comparable and readily available ground to pursue this analysis, a representative data point for the connector’s efficiency actually is the average resistance value of the set of tested connectors at the end of the 1000 cycles (EN 50483-5). Therefore, while the traditional sanctions of heat cycling test do not provide indication of efficiency, such test provides a great indication of efficiency when looking at what we will now call ‘ultimate resistance’ of the set of connectors.
EFFICIENCY SCALE OF IPC CONNECTORS
Now that a measurable, comparable and reasonably available assessment data is defined, it becomes possible to compare connectors. Before to go any further, it is important to note that any connector comparison shall be performed on the same conductor sections for main and tap – and preferably, on the same conductor batches.
Once this piece of caution taken, it is to say that not all connectors are born equal when it comes to this value at the end of the test.
To illustrate these discrepancies, below figure presents the result of a comparative electrical ageing test performed on 5 connector models accommodating 3/0 AWG cable run and tap (2 connectors tested per model). This test has purposely involved only leading brand international connectors (IPC 1-2-3-5) presenting high quality image but for 1 connector (IPC4) which is medium-quality – price-oriented product. Connector 4 is not stable. The level of losses induced by this type of connectors will exceed any calculations that will be performed in the following paragraphs of this paper. Such connector probably will have an important failure rate, but more importantly, they will induce losses exceeding in a few months the savings the utility has gained thanks to its low price.
The other IPCs are stable and generally qualify per the traditional electrical ageing sanction. What we can observe though is that the average ‘ultimate resistance’ ranges from 28 µΩ for the most efficient connector to 67 µΩ. Therefore, even in the high-quality leading brands, for the very same application, resistance will range from 1 to 2, even 1 to 3 in other tests performed. It is also to be noticed that the initial resistance value (resistance right after installation) is not representative of the end value obtained. Considering these various behaviors of connectors, a simple way to illustrate efficiency variations is to use an efficiency scale ranking from the most efficient class of connectors to the least efficient as could be used for appliances for instance.
This scale has been arranged so that most of nowadays IPC products offered on the market range between B for the common leading brands, C-E for average connectors and F-G for the worsts. While very few products meet the grade A of the scale, only one connector type of the studied panel (30+ connector models from various brands) meets the A+ grade. Once again, as losses are proportional to the square of the amperage flowing through the connector, the efficiency of the connector (and therefore its ‘ultimate resistance’) gets more critical as accommodated conductor sections get bigger. Therefore, while requiring grade A for a street lighting connector (tap up to #8 AWG) may not be the best technical-economical investment because of the extremely low level of amperage accommodated. To the contrary, the grade of connectors per the proposed scale becomes significant for service connectors (tap from #6 to #2 AWG) and even absolutely crucial for network applications (tap section above #1 AWG) where A and A+ grade requirements are to be considered.
ENVIRONMENTAL IMPACT OF CONNECTOR EFFICIENCY
Many indicators exist to assess the environmental impact of products (Raw material depletion, water and energy depletion, global warming potential, hazardous waste production…). Global warming potential could be recognized as a more or less trans-national indicator (in lb CO2 emissions). To consider the environmental impact, one should assess the life span of the product taking into account: raw material, production, distribution, use, end of life.
End of life shall be disregarded for now as 1/ the lifespan of the product is very long, 2/ low discrepancy exists amongst connectors, 3/ revalorization of materials only helps the overall footprint. We shall also overlook impact of distribution which is very similar amongst connectors and in any case negligible vs. the use phase. Looking at raw material, copper blade will have a double benefit over aluminum blades:
1/ copper blade allow for more conductivity, less resistance and therefore less losses, but also, 2/ only 4.189 lbs CO2 equivalent is required to obtain 2.2 lbs of Copper raw material while 4.189 lbs CO2 equivalent is required for the same weight in aluminum. Besides this differential, most connectors shall be comparable. Raw material and manufacturing may represent 2-20% of the global warming potential of a connector (~1.1-3,3 lbs CO2 equivalent pending on the IPC size) When studying environmental impact of IPCs, the actual ‘use’ phase represents most of the global warming potential. Indeed, the losses illustrated in the previous chapter do contribute to the global warming.
In a country where production of a kWh generates emission of 1.1 lbs CO2 equivalent, IPC1 will represent throughout its lifespan an emission of 79.36 lbs CO2 equivalent while IPC2 represents 357 lbs CO2 equivalent in the use phase. When compared to manufacturing, the ‘use’ phase is definitely the most impacting phase of the connector lifespan. When looking to optimize environmental footprint, once again, efficient connectors make the most impact. That being said the impact is very different from one country to another and from one energy source to another. Following chart provides and order of magnitude of emissions by source of energy. While impact of IPC2 in a country mostly using coal may climb up to 928 lbs CO2 equivalent per connector, an IPC1 in a country having a pool of low emitting sources (1.76 lbs CO2/kWh) may have an impact throughout its life span of 11-13 lbs CO2 equivalent over the same period of 30 years.
CONNECTOR ERGONOMY AND INSTALLATION
At this stage, we have demonstrated that pending on the connector design: the efficiency may vary significantly between connectors leading to economic and environmental impact. What is absolutely crucial, however, is to ascertain that such findings, obtained typically in lab conditions, are implemented consistently by linemen crews on the field. While linemen trainings are important, it is not enough to secure perfect execution on repetitive tasks. Connector’s shear heads principal is now generalized. This is the best way to secure consistent installation torque.
A second help to the installer is too often disregarded: the connector handling during installation is crucial. A good grip while the connector is applied and tightened is the only way to make sure the connector is well aligned with the conductors for optimum connection quality. If this aspect is not secured, then, connector teeth will not necessarily make an optimal connection area with the conductor core, securing coherent performance on the field. It shall be possible to hold the connector while tightening thanks to an accessory which prevents the connector from rotating when torque is applied to the hardware. Practically such tool shall be standard and easy to handle with protective gloves to encourage best practices. Another installation feature, which is often overlooked, for product performance over time is the tap conductor end protection. As an example, soft caps insulation depends on the way it has been mounted by linemen as it is an additional step in the installation routine. If that step has not been properly performed, the cap may fall and, then, active part becomes accessible. Also, water can then get in the cable which will eventually downgrade connection performance. With a hard cap fixed on the connector, the insulation of the end of the tap cable is made directly during the introduction of the cable. It does not require any additional man-dependent action. As the cap is made of hard plastic, they are no risk of piercing it. After the connector is being installed, it is not be possible to remove the cap which prevents from electrification hazards. These two features are only illustrations of how an IPC may be easier to install, which results ultimately in more consistent installations and efficient connectors. New features available on the market such as impact-wrench compatible IPCs are other opportunities to contribute to overall consistency of installation.
CONNECTOR SELECTION AND QUALITY PROCESS
Many design, manufacturing or quality parameters can support IPC quality and efficiency: plastic material quality, injection process control, conductor metal selection, hardware torque-force ratio consistency… Any lack of consistent monitoring for one of these parameters will lead to more resistive connectors or even failures. Connector resistance is composed of contact resistance and transfer resistance. Transfer resistance is dependent on the resistance characteristics of the material used for the blades. Copper blades (0.669 µΩ.in./in) are obviously less resistive than aluminum alloys ones fit for such application (1.575 µΩ.in./in), unless the latter ones are oversized in cross section. The second component of an IPC resistance, contact resistance, is definitely the most complicated to model and is heavily related to the design itself. Moreover, maintaining low such contact resistance over time is the key known-how of any IPC manufacturer. This capability can only be assessed through a legitimate electrical ageing test. Selecting connectors and reliable manufacturers is not an easy task: nothing looks more like an IPC than another IPC. Every utility that has successfully implemented a quality supply of IPCs – and other accessories – has typically followed a very formal qualification process including not only ‘test reports’ review but also an overall assessment of the products behavior on the field as well as a monitoring of the supplier’s quality system. The following chart provides an illustration of best in class approach to qualify products. Such process shall be completed by appropriate certifications: ISO17025 certification for labs performing tests as well as EN45011 certification process for the overall qualification when necessary. In general, manufacturers should be able to justify of quality resources, engineering skills as well as testing facilities matching with the product they offer. While this may seem common sense, such assessment shall be very useful in order to discriminate legitimate suppliers able to provide appropriate technical expertise and support. Obtaining quality products obviously starts by defining appropriate product specifications. When looking for efficient and reliable IPCs, the following points shall be considered:
- Use a strong standard as a reference framework, NFC-33 020 (2013) is probably the most complete and secured reference as this paper is written.
- Make sure no water will get in the connection (incl. In NFC-33 020 – or when EN 50483 is considered, select class1-method1 only)
- Define criteria for easy and consistent installation as described above. Make sure, products are tested on the field. Require meaningful references
- And, last but not least, define an efficiency target, in other words a limit value for average resistance at the end of electrical ageing test. ‘Grade A’ of the scale (max 40 µΩ) seem currently a realistic target providing the best techno-economic benefits.
LV IPC EFFICIENCY: A SIZABLE OPPORTUNITY FOR UTILITIES
As a summary, LV connector efficiency and reliability, while small at the unit level, becomes significant when considering 1/ the millions of connectors installed on any network and 2/ the fact that every kWh reaching any meter shall flow through 4 or more of these connectors.
If 10-50 cents can be saved every year for each connector installed on the network, savings for any sizable utility will reach 6 to 7-digit values yearly.
The objective of this paper was to highlight this potential offered to utilities: secure reliability and improve efficiency of their networks. One shall hope that utilities will benefit from the very practical avenues laid out to yield this potential.
ADVANTAGES OF INSULATION PIERCING CONNECTOR
Insulation piercing connectors (IPC) are designed with lower installation costs in mind. No special tooling is required as they are wrench installed. When joining insulated conductors (their principal use), no insulation stripping or application of oxide inhibitor is required making the connection much simpler. IPCs incorporate contact teeth designed to penetrate conductor insulation, make electrical contact, are angled so that the insulation fits snugly around them, and are pre-filled with an oxide inhibiting compound to fill voids preventing contamination. Many IPCs come with shear head bolts negating the need to monitor the installation torque with a torque wrench.
Insulation piercing connectors are themselves insulated, thus, no tape or special cover is required after making the connection. Installations on energized conductors can be easily made and are relatively safe.
Shear head bolt – Ensure the tightening force is not to damage the conductor.
Full-insulating function to the screw – The screw of Canadian Power Manufacturing’s insulating connector is completely insulated to conductive parts of IPCs. This feature enhances the safety for the engineer under severe condition.
Contact protector – protect the blade teeth from water penetration and oxidization. Our contact protector can be seen as the best one on the market.
Conductor end cover – protect the tap conductor end from dust and water penetration, especially to help the engineer to avoid electric shocks
|
MATERIALS INFORMATION |
|
|
Insulating body |
Polyamide 66 (PA66) + 50% fiberglass resistant to U.V, thermal and mechanical effects. |
|
Contact blades |
Tinned copper-alloy |
|
Contact blade seal and endcap seal |
Thermoplastic rubber resistant to U.V |
|
Shear head bolt |
Aluminum |
|
Sealing grease |
The manufacturer declared the sample’s sealing grease satisfying to dropping point test under ASTM D 566:2009 (at 200 ºC) |
|
Screw/washer/nut |
Galvanized steel |
SAFETY CONSIDERATION
1. This product is intended for use by trained craftspeople only. This product SHOULD NOT BE USED by anyone who is not familiar with and trained in the use of it.
2. When working in the area of energized lines with this product, EXTRA CARE should be taken to prevent accidental electrical contact.
3. For PROPER PERFORMANCE and PERSONAL SAFETY be sure to select the proper size EMAAR product before application.
4. EMAAR products are precision devices. To insure proper performance, they should be stored in cartons under cover and handled carefully.
Related Products
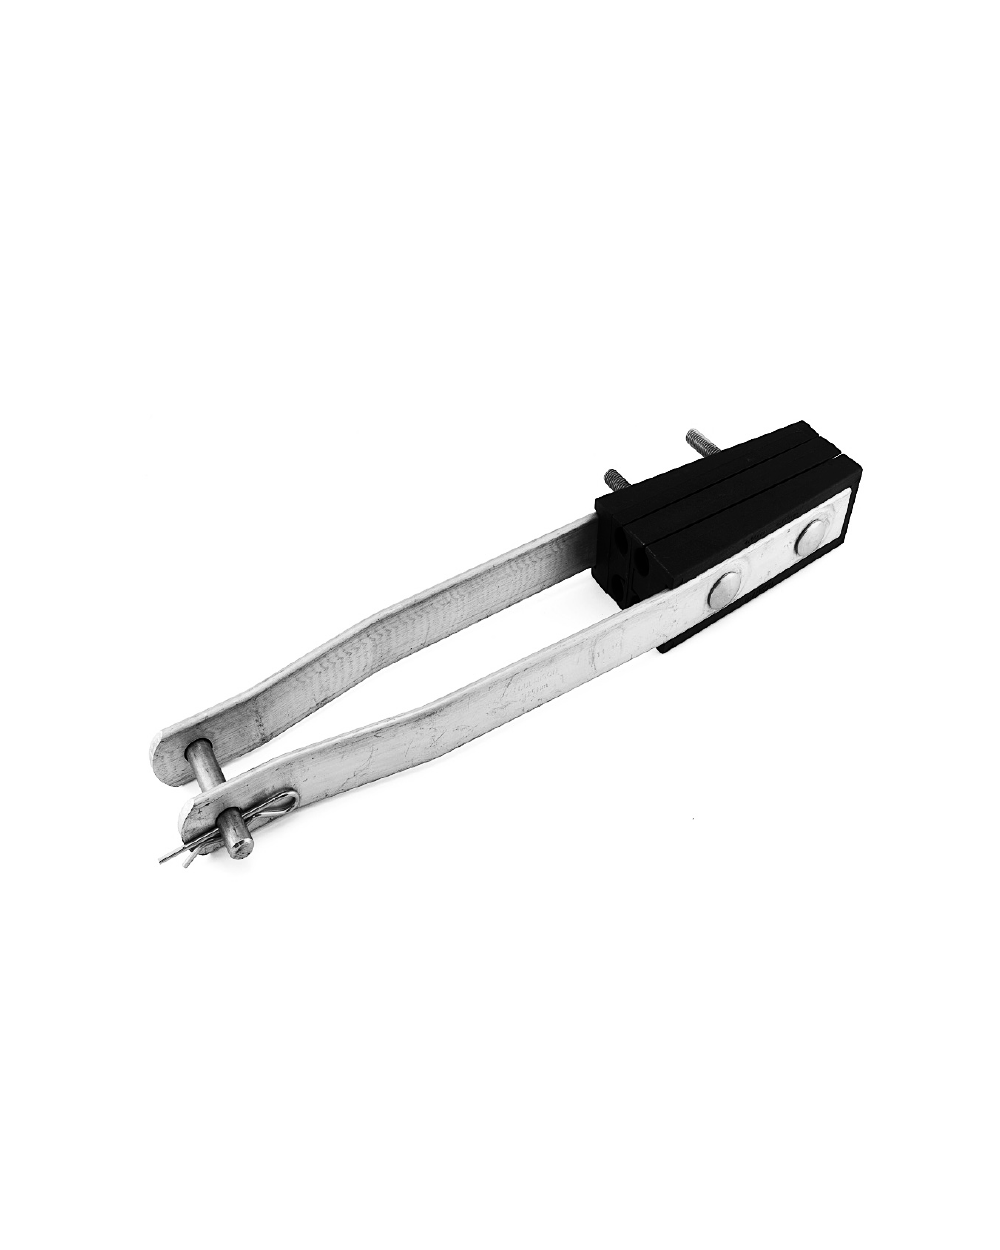
OH - ABC - Clamp - PINCE-CAKE
ABC Insulated Tensioner
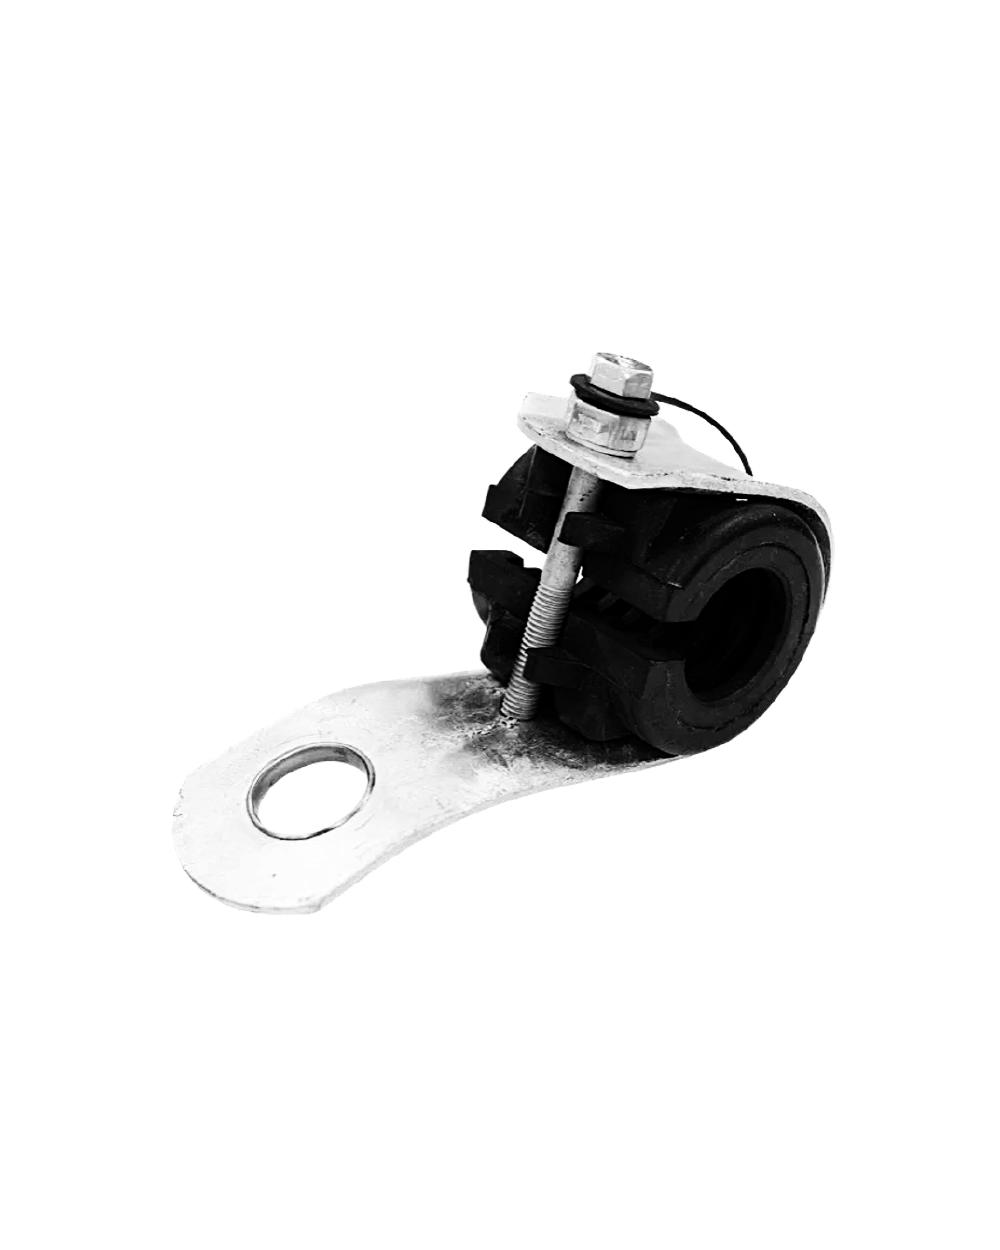
OH - ABC - Clamp - PINCE-OCTOx
ABC Bolted-Wedge Anchoring Clamp
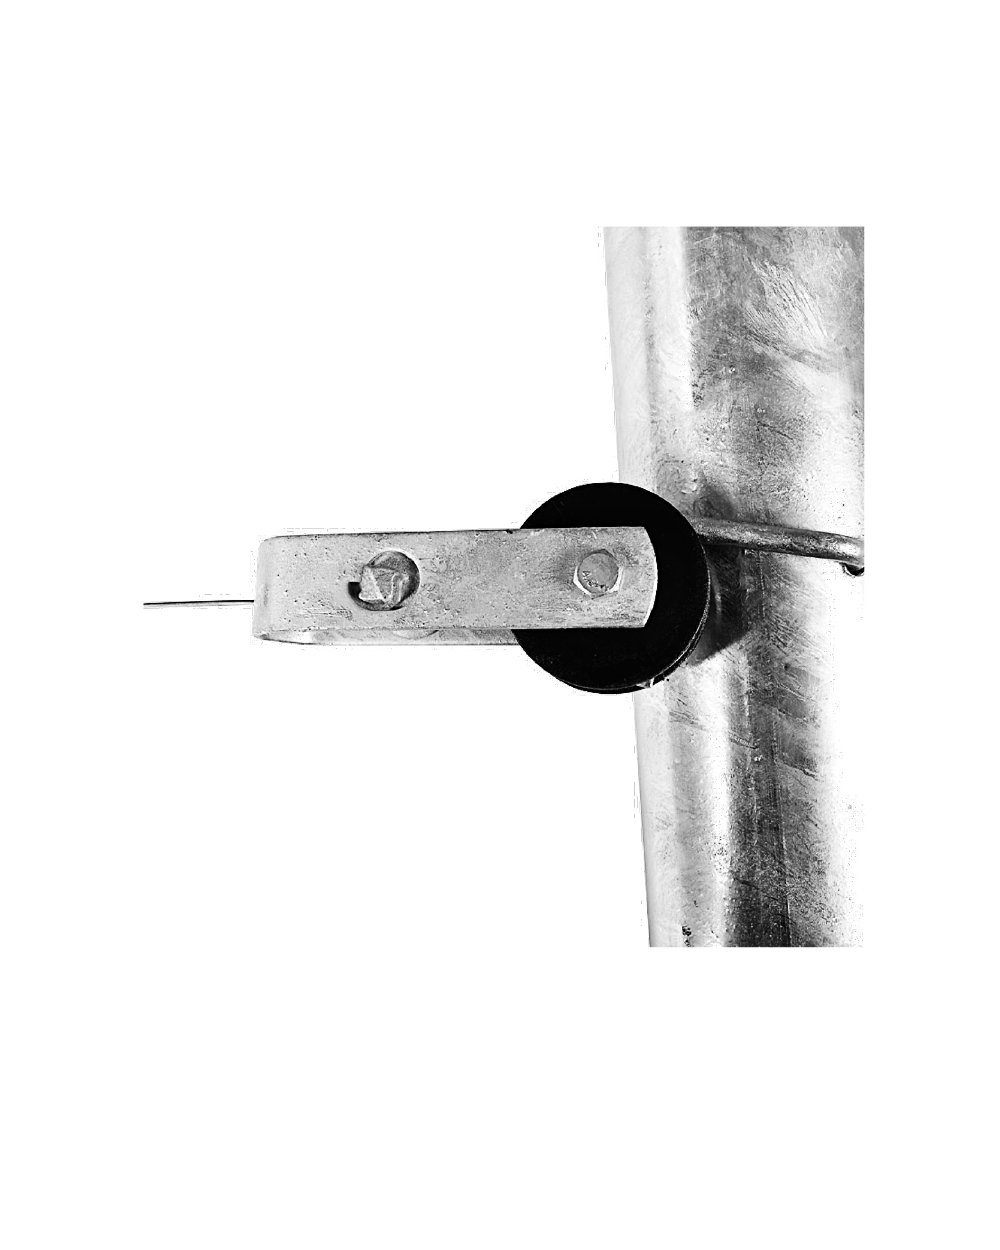
OH - ABC - Clamp - PINCE-WORM
ABC Suspension Clamp
OH - MV - Clamp - PINCE-SNAIL
Bolted Stirrup Clamp